Transmitter Specs
Having little exposure to Industry, academic researchers wonder if they are designing the transmitter for the right metrics? Are transmitter specs all about output power and linearity? And besides what metrics are used by industry to characterize linearity? If you have such questions, you have landed at correct place. Take a look at the transmitter specs used by industry.
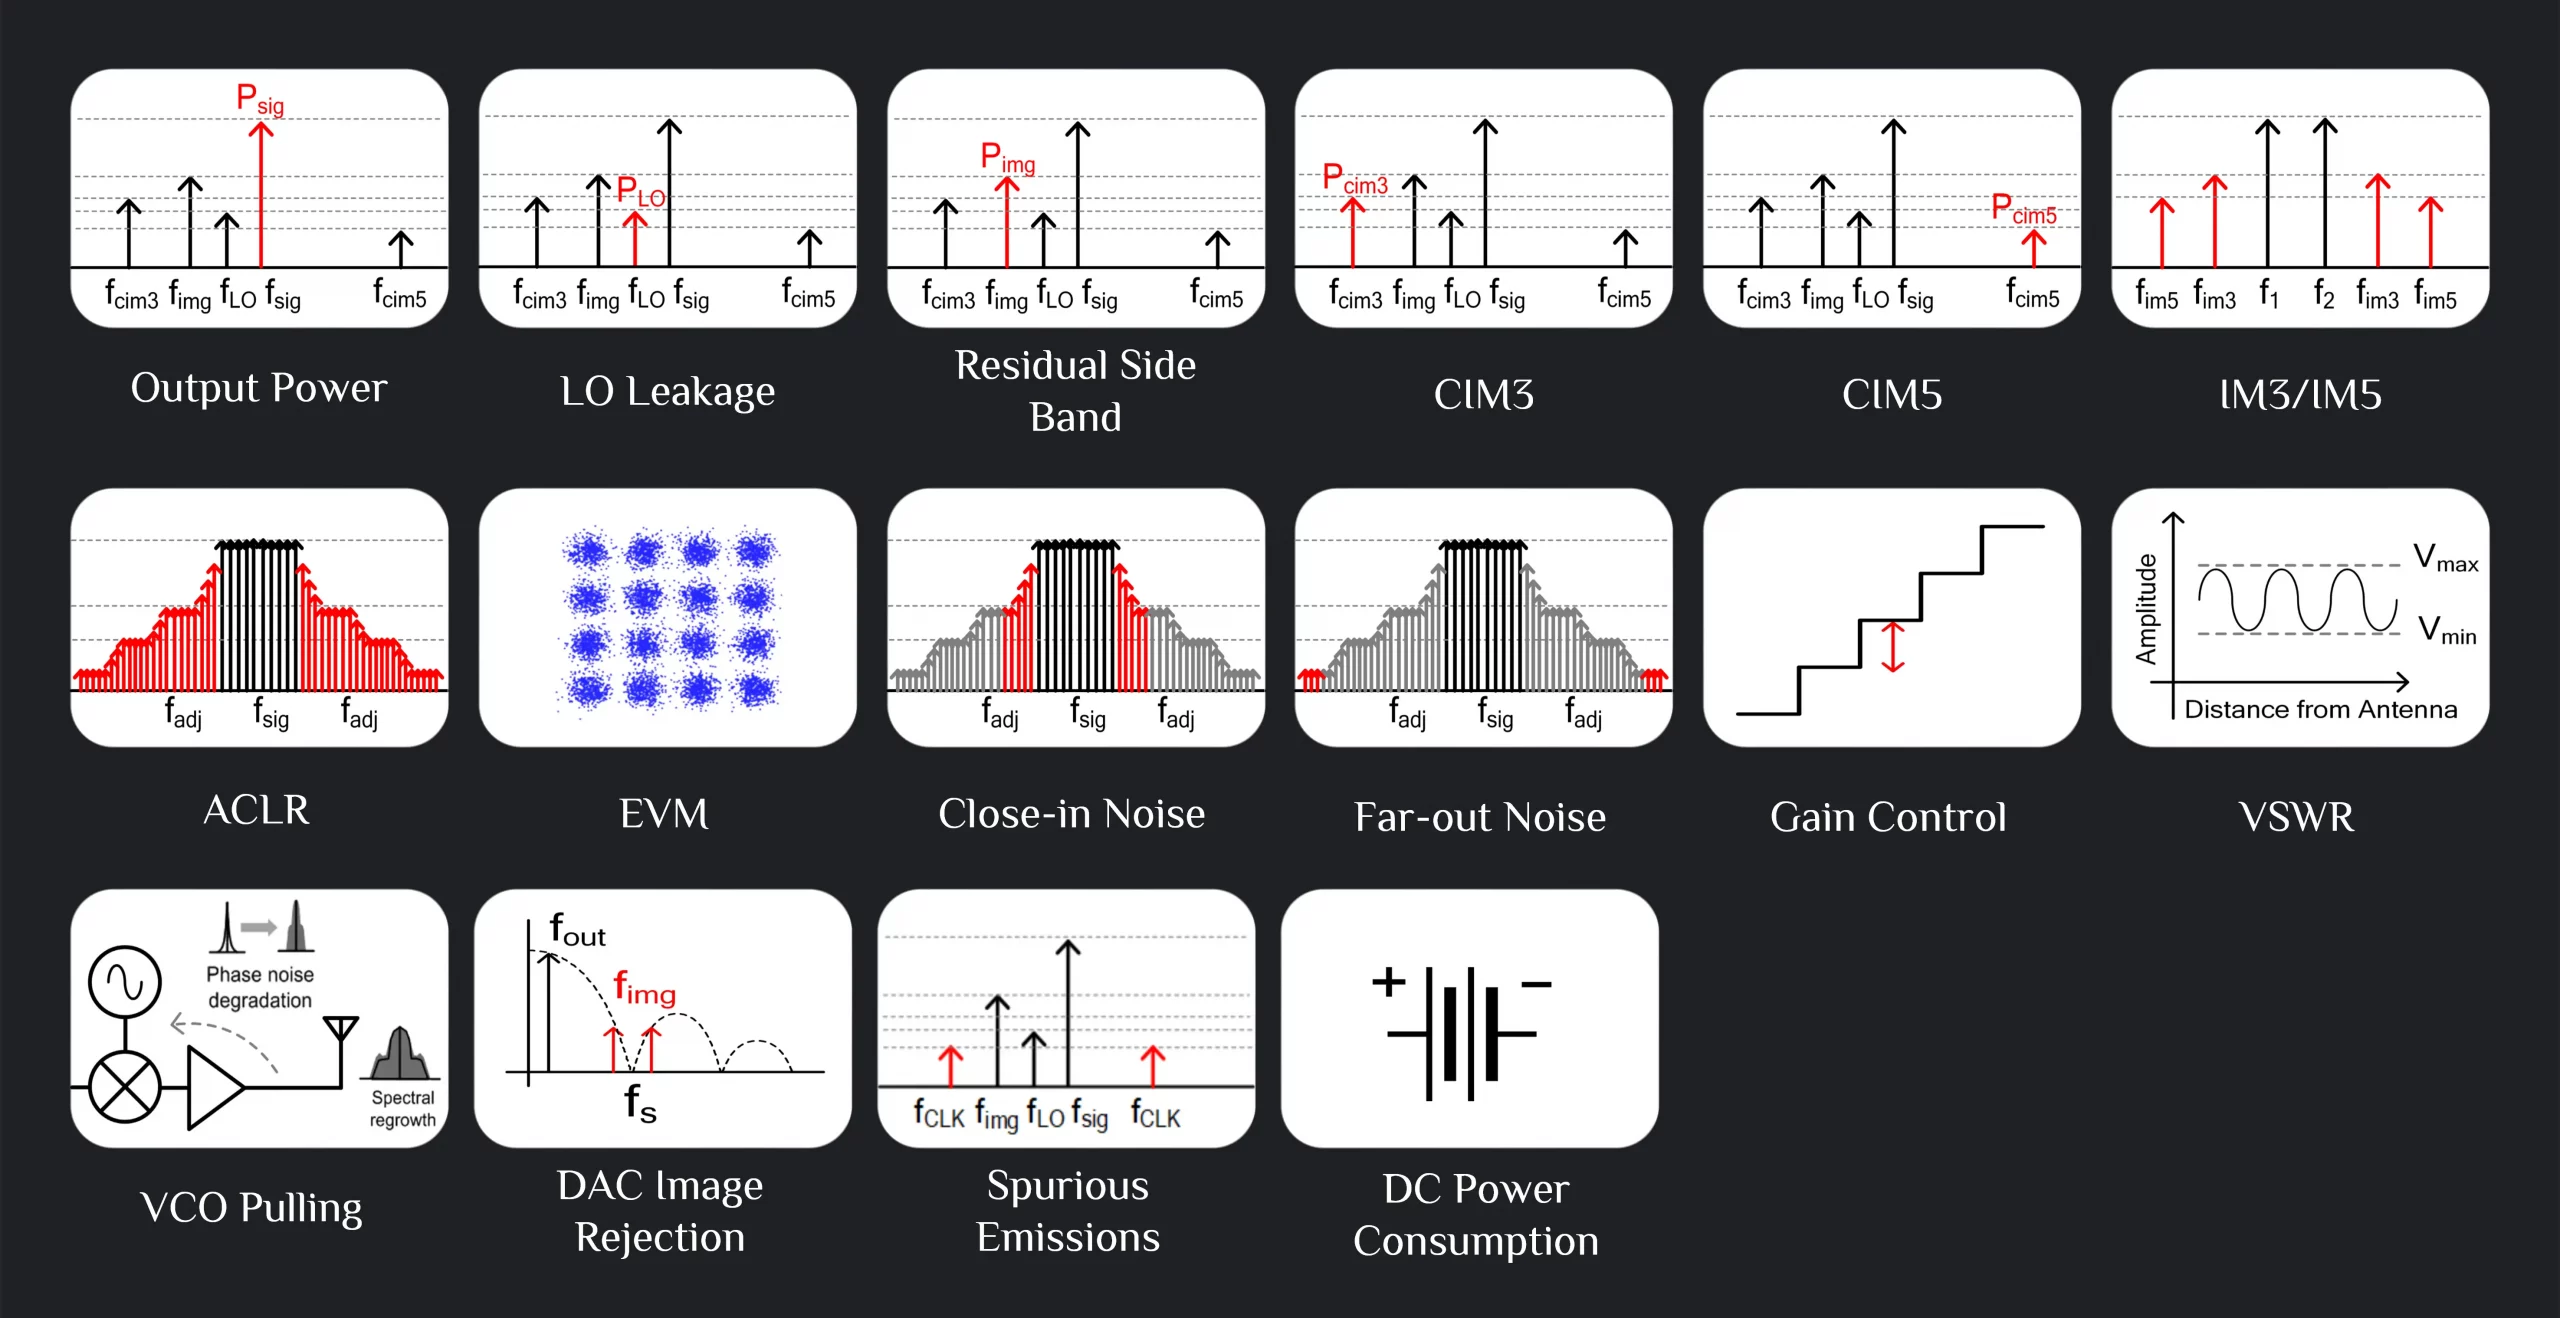
Key Transmitter Specs
1. Output Power
You knew it. Output power matters.
2. Residual Sideband
Almost all the transmitters you see today are single side band, that means you want to transmit either upper side band (\(f_{lo}+f_{bb}\)) or lower side band (\(f_{lo}-f_{bb}\)) but not both. Residual side band, measured in dBc, is a measure of how much other sideband is rejected. Say, \(f_{lo}+f_{bb}\) is your desired sideband and you have spec of -60dBc residual sideband band, that means \(f_{lo}-f_{bb}\) should be 60dB lower than \(f_{lo}+f_{bb}\). To ge to such levels though, IQ calibration is required.
3. LO Leakage
Something that always leaks. LO leakage, measured in dBc, means how much your LO signal is lower compared to your desired signal. LO signal is present at TX output either by direct leakage or through different mechanisms that produce LO leakage like up-conversion of DC offset or downconversion of \(2f_{lo}\) components.
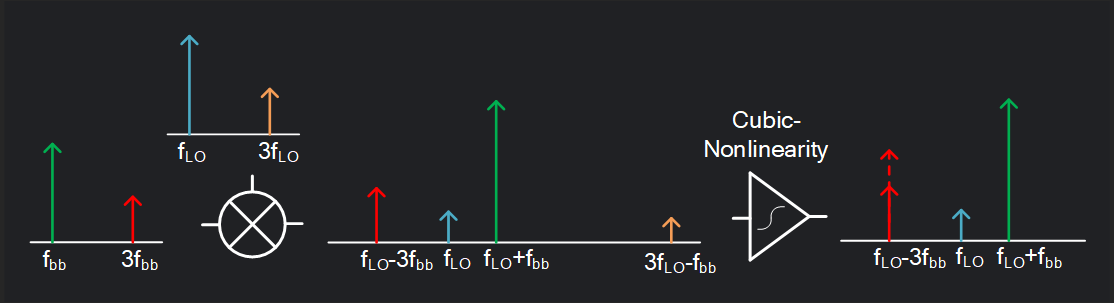
4. Counter IM3 or Primary 4FMOD
This metric is not readily available in textbooks to learn about yet it is a very important one because it is only \(4f_{bb}\) away from your desired signal, hence called 4FMOD. Say, \(f_{lo}+f_{bb}\) is your desired signal, then anything at \(f_{lo}-3f_{bb}\) frequency would be called CIM3 or P4FMOD. Similarly, if \(f_{lo}-f_{bb}\) is your desired band, then P4FMOD would be at \(f_{lo}+3f_{bb}\). It helps to remember that P4FMOD always falls on the opposite side of LO (meaning if your signal is on upper side of LO, P4FMOD would be at lower side).
It is generated by two ways:
- When \(HD_{3}\) of baseband signal (i.e., \(3f_{bb}\)) upconverts and land at \(f_{lo}-3f_{bb}\)
- When \(3f_{lo}-f_{bb}\) inter-modulates through cubic nonlinearity of subsequent stages
We have dedicated a separate article to 4FMODs.
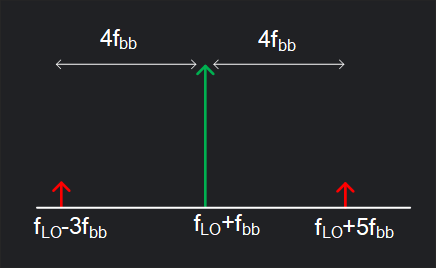
5. Counter IM5 or Secondary 4FMOD
Similar concept as CIM3. It is generated when \(HD_{5}\) of baseband signal upconverts to \(f_{lo}+5f_{bb}\). Since this is again \(4f_{bb}\) away from main signal, it is also called as 4FMOD although a secondary one because it comes from weak (\(5^{th}\) order) non-linearity.
6. DAC Image or Alias Rejection
Nothing in this world is perfect. DAC (digital to analog converter) is an integral part of any TX, and it comes with its own impairments. If you ask DAC to give \(f_{bb}\) signal, it will give you \(f_{bb}\) but also spits out images which falls around its sampling frequency (\(f_{s}\)). For example, \(f_{s}-f_{bb}\) is the closest image, then \(f_{s}+f_{bb}\), then \(2f_{s}-f_{bb}\), then \(2f_{s}+f_{bb}\) and so on. Read more on this here.7. Baseband Emissions
In general, any harmonic of baseband signal will get upconverted and emit at TX output. We call it baseband emissions and they can be further characterized on which side of signal they fall. For example, if our signal is at \(f_{lo}+f_{bb}\), then \(f_{lo}+2f_{bb}\) would be called same-side and \(f_{lo}-2f_{bb}\) as opposite-side baseband \(HD_{2}\) emission. A two-tone test captures above impairments. An output spectrum of a real TX is shown in image [1] below.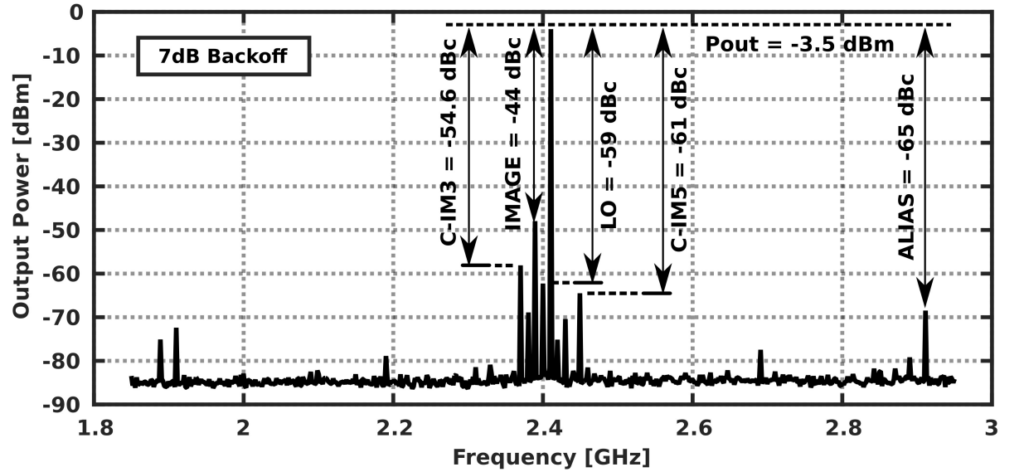
8. Band Tilt
Band tilt is a measure of asymmetry between lower and upper sideband. Ideally, you should be able to choose which sideband to transmit, and they both should have same output power. Say, you want to transmit lower sideband and it gives 0.1dB higher output power compared to upper sideband, then your band tilt would be 0.1dB. It is an important metric to keep emissions symmetric between left and right of LO and to reduce in-band frequency response ripple.9. IM3 and IM5
You have heard of them. They are very important metrics in determining the TX distortion. Two signal tones \(f_{bb1}\) & \(f_{bb2}\) inter-modulates and produce \(2f_{bb1}-f_{bb2}\) & \(2f_{bb2}-f_{bb1}\). These are so close to signal that they just cannot be filtered out, hence we need to take great care in reducing them. You knew it already, so lets move on to other metrics.10. Noise
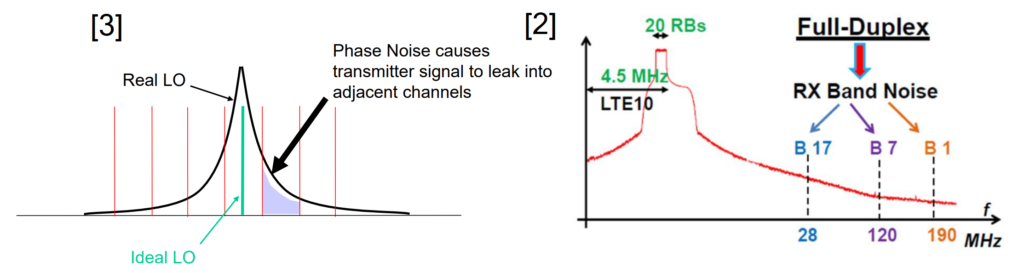
TX is not all about output power and linearity. Noise also matters. TX noise can be put in two categories:- Far-out noise: De-sensitizes your own on-chip receiver when you are in FDD mode. Also called as RX Band Noise.
- Close-in noise: It falls in ACLR region (mostly LO phase noise). So even if your TX was perfectly linear, it would still fail ACLR because of noise and it does happen. You see noise dominates spectral leakage close-in to your signal [3].
11. ACLR & EVM
Now you are talking. These happen to be the most important design specs. ACLR is a measure of adjacent channel or out-of-band distortion whereas EVM is more of a in-band distortion metric. Your TX is not perfectly linear so your in-band tones inter-modulates with each other and produce IM3/IM5, CIM3/CIM5, baseband emissions etc. etc. (all the goodies mentioned above). All these add together (in or out of phase) plus noise to create leakage in adjacent channel. And then memory effect also comes in making distortion products asymmetric, and thus you see different left and right ACLR. Similarly, distortion products also fall in-band plus you have LO leakage and residual sideband, and of course noise; all of these act together to corrupt your signal leading to deviation of constellation points from ideal positions, thereby giving bad EVM. See our breakdown of ACLR & EVM.12. Gain Control
Gain control is crucial part of any TX, and it is a big deal because you are interested in seeing same performance (linearity & noise) over the gain control range which is very hard, and also precise gain steps are required over parts and temperature.
13. VSWR
RF or mm-wave, TX output is required to be matched to interface with next block (usually a front-end filter or PA). A 2:1 VSWR is considered good.
14. Pulling / Isolation
A lot of simulations are done to check isolations between different EMs on-chip (inductors, baluns, TR lines etc.). You can dead optimize your TX for distortion and noise, only to see poor isolation between two blocks giving you spurs that you just cannot get rid of, and you start failing your emissions or ACLR. One particular study that is done before tapeout is isolation between VCO inductors and TX. Any TX signal that leaks to VCO will pull it, degrading its phase noise or generating spurs that eventually end up on your TX output.
Things couple in three main ways:
- PCB (Long T-line feeds)
- Package (bumps, VDD/GND planes, loops)
- On-chip (inductors, shared GNDs)
15. Spurious Emissions
Spurious emissions refer to different spurs (DAC, CLK, PLL, LO) modulated or un-modulated making there way to TX output. TX output is scanned across wide frequency range and any spur that is above a threshold (determined by emission mask) is either planned to be filtered by front-end filter if it is far away from signal, if not then starts a long debug process to figure out what caused it and how to fix it in next tapeout.
16. Transient Settling
Transient overshoot and settling times are checked from ON to OFF, OFF to ON and between switching gain states. How long does it take for EVM or ACLR to stabilize during transients, that is also looked at.
References:
Author: RFInsights
Date Published: 09 Oct 2022
Last Edit: 02 Feb 2023